本文参考《Google机器学习速成课程》使用TF的基本步骤
点击下载源码
设置
import math
from IPython import display
from matplotlib import cm
from matplotlib import gridspec
from matplotlib import pyplot as plt
import numpy as np
import pandas as pd
from sklearn import metrics
import tensorflow as tf
from tensorflow.python.data import Dataset
tf.logging.set_verbosity(tf.logging.ERROR)
pd.options.display.max_rows = 10
pd.options.display.float_format = '{:.1f}'.format
california_housing_dataframe = pd.read_csv("https://storage.googleapis.com/mledu-datasets/california_housing_train.csv", sep=",") #加载数据集
california_housing_dataframe = california_housing_dataframe.reindex(
np.random.permutation(california_housing_dataframe.index))
#对数据进行随机化处理,以确保不会出现任何病态排序结果(可能会损害随机梯度下降法的效果)
california_housing_dataframe["median_house_value"] /= 1000.0
#将 median_house_value 调整为以千为单位
IPython
ipython是一个python的交互式shell,比默认的python shell好用得多,支持变量自动补全,自动缩进,支持bash shell命令,内置了许多很有用的功能和函数,也是利用Python进行科学计算和交互可视化的一个最佳的平台。
IPython提供了两个主要的组件:
1.一个强大的python交互式shell
2.供Jupyter notebooks使用的一个Jupyter内核(IPython notebook)
安装IPython:
pip install ipython
pip install jupyter #想在notebook中或者在Qt console中使用IPython,我们还需要安装Jupyter
pip install numpy #NumPy高性能多维数组矢量运算库
pip install matplotlib #Matplotlib绘图以及交互式可视化
使用IPython:
1.直接win + R打开运行,然后输入ipython即可
2.输入ipython qtconsole进入ipython图形交互界面
使用IPython Notebook:
Win+R打开运行,输入ipython notebook,如果正确安装的话,这个命令就会默认在本地8888端口启动一个web服务,并自动打开浏览器,打开http://localhost:8888/tree页面,在这个页面我们可以看到当前目录下的所有文件夹以及ipynb文件。
scikit-learn(sklearn)
sklearn是基于numpy和scipy的一个机器学习算法库,让我们能够使用同样的接口来实现所有不同的算法调用。支持包括分类、回归、降维和聚类四大机器学习算法,还包含了特征提取、数据处理和模型评估三大模块。拥有着完善的文档,上手容易,具有着丰富的API,内置大量数据集,在学术界颇受欢迎。
构建第一个模型
会使用以下两类数据:
- 分类数据:一种文字数据。在本练习中,我们的住房数据集不包含任何分类特征,但您可能会看到的示例包括家居风格以及房地产广告词。
- 数值数据:一种数字(整数或浮点数)数据以及您希望视为数字的数据。有时您可能会希望将数值数据(例如邮政编码)视为分类数据(我们将在稍后的部分对此进行详细说明)。
    #一开始,我们只使用一个数值输入特征
    total_rooms my_feature = california_housing_dataframe[["total_rooms"]]
    #特征列仅存储对特征数据的描述
    feature_columns = [tf.feature_column.numeric_column("total_rooms")]
    #使用 numeric_column 定义特征列,这样会将其数据指定为数值。total_rooms 数据的形状是一维数组,是 numeric_column 的默认形状,因此我们不必将其作为参数传递。
    #定义目标,也就是 median_house_value
    targets = california_housing_dataframe["median_house_value"]
    #使用 GradientDescentOptimizer(小批量随机梯度下降法 (SGD))训练该模型
    my_optimizer=tf.train.GradientDescentOptimizer(learning_rate=0.0000001)
    #通过 clip_gradients_by_norm 将梯度裁剪应用到我们的优化器。
    my_optimizer = tf.contrib.estimator.clip_gradients_by_norm(my_optimizer, 5.0)
    #梯度裁剪:在应用梯度值之前先设置其上限,有助于确保数值稳定性以及防止梯度爆炸。
    #Configure the linear regression model with our feature columns and optimizer.
    #Set a learning rate of 0.0000001 for Gradient Descent.
    linear_regressor = tf.estimator.LinearRegressor(
        feature_columns=feature_columns,
        optimizer=my_optimizer )
    def my_input_fn(features, targets, batch_size=1, shuffle=True, num_epochs=None):
        """Args:
          features: pandas DataFrame of features
          targets: pandas DataFrame of targets
          batch_size: 指单步的样本数量(随机选择)
          shuffle: 设置为 True,则会对数据进行随机处理,以便数据在训练期间以随机方式传递到模型
          num_epochs: 所有数据重复次数 None = 无限重复
        Returns:
           (features, labels) 为该数据集构建一个迭代器,并向 LinearRegressor 返回下一批数据。
        """
        #把DataSet转为字典形式,{'total_rooms': array([3823., 2271., ..., 1461.])}
        features = {key:np.array(value) for key,value in dict(features).items()}
        #Construct a dataset, and configure batching/repeating
        ds = Dataset.from_tensor_slices((features,targets)) # warning: 2GB limit
        #打乱组成batch_size的batch,并重复无限次
        ds = ds.batch(batch_size).repeat(num_epochs)
        #Shuffle the data, if specified
        if shuffle:
          ds = ds.shuffle(buffer_size=10000)
        #Return the next batch of data
        features, labels = ds.make_one_shot_iterator().get_next()
        return features, labels
    #训练 100 步
    _ = linear_regressor.train(
        input_fn = lambda:my_input_fn(my_feature, targets),
        steps=100 )
    #评估模型
    #因为只做一次预测,因此num_epochs=1,shuffle=False.
    prediction_input_fn =lambda: my_input_fn(my_feature, targets, num_epochs=1, shuffle=False)
    #Call predict() on the linear_regressor to make predictions.
    predictions = linear_regressor.predict(input_fn=prediction_input_fn)
    #Format predictions as a NumPy array, so we can calculate error metrics.
    predictions = np.array(item['predictions' for item in predictions])
    #Print Mean Squared Error and Root Mean Squared Error.
    mean_squared_error = metrics.mean_squared_error(predictions, targets)
    root_mean_squared_error = math.sqrt(mean_squared_error)
    print "Mean Squared Error (on training data): %0.3f" % 均方误差
    print "Root Mean Squared Error (on training data): %0.3f" % 均方根误差
    #这是出色的模型吗?您如何判断误差有多大?
    #比较一下 RMSE 与目标最大值和最小值的差值
    min_house_value = california_housing_dataframe["median_house_value"].min()
    max_house_value = california_housing_dataframe["median_house_value"].max()
    min_max_difference = max_house_value - min_house_value
    print "Min. Median House Value: %0.3f" % min_house_value
    print "Max. Median House Value: %0.3f" % max_house_value
    print "Difference between Min. and Max.: %0.3f" % min_max_difference
    print "Root Mean Squared Error: %0.3f" % root_mean_squared_error
    #Min. Median House Value: 14.999
    #Max. Median House Value: 500.001
    #Difference between Min. and Max.: 485.002
    #Root Mean Squared Error: 237.417
    #误差跨越目标值的近一半范围,需要制定一些基本策略,以降低模型误差
    #了解一下根据总体摘要统计信息,预测和目标的符合情况
    calibration_data = pd.DataFrame()
    calibration_data["predictions"] = pd.Series(predictions)
    calibration_data["targets"] = pd.Series(targets)
    calibration_data.describe()
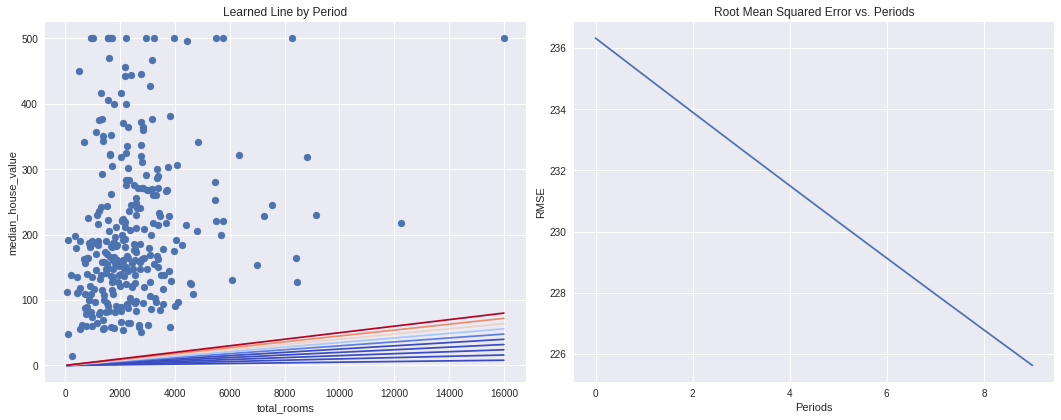
    #将数据和学到的线可视化
    sample = california_housing_dataframe.sample(n=300)
    #Get the min and max total_rooms values.
    x_0 = sample["total_rooms"].min() x_1 = sample["total_rooms"].max()
    #Retrieve the final weight and bias generated during training.
    weight = linear_regressor.get_variable_value('linear/linear_model/total_rooms/weights')[0]
    bias = linear_regressor.get_variable_value('linear/linear_model/bias_weights')
    #Get the predicted median_house_values for the min and max total_rooms values.
    y_0 = weight * x_0 + bias
    y_1 = weight * x_1 + bias
    #Plot our regression line from (x_0, y_0) to (x_1, y_1).
    plt.plot([x_0, x_1], [y_0, y_1], c='r')
    #Label the graph axes.
    plt.ylabel("median_house_value")
    plt.xlabel("total_rooms")
    #Plot a scatter plot from our data sample.
    plt.scatter(sample["total_rooms"], sample["median_house_value"])
    #Display graph.
    plt.show()

![[TF.3]多特征训练与交叉验证](https://blog.mclover.cn/wp-content/themes/slanted/img/thumb-medium.png)